


Client: The Intercontinental Hotels Group (IHG)
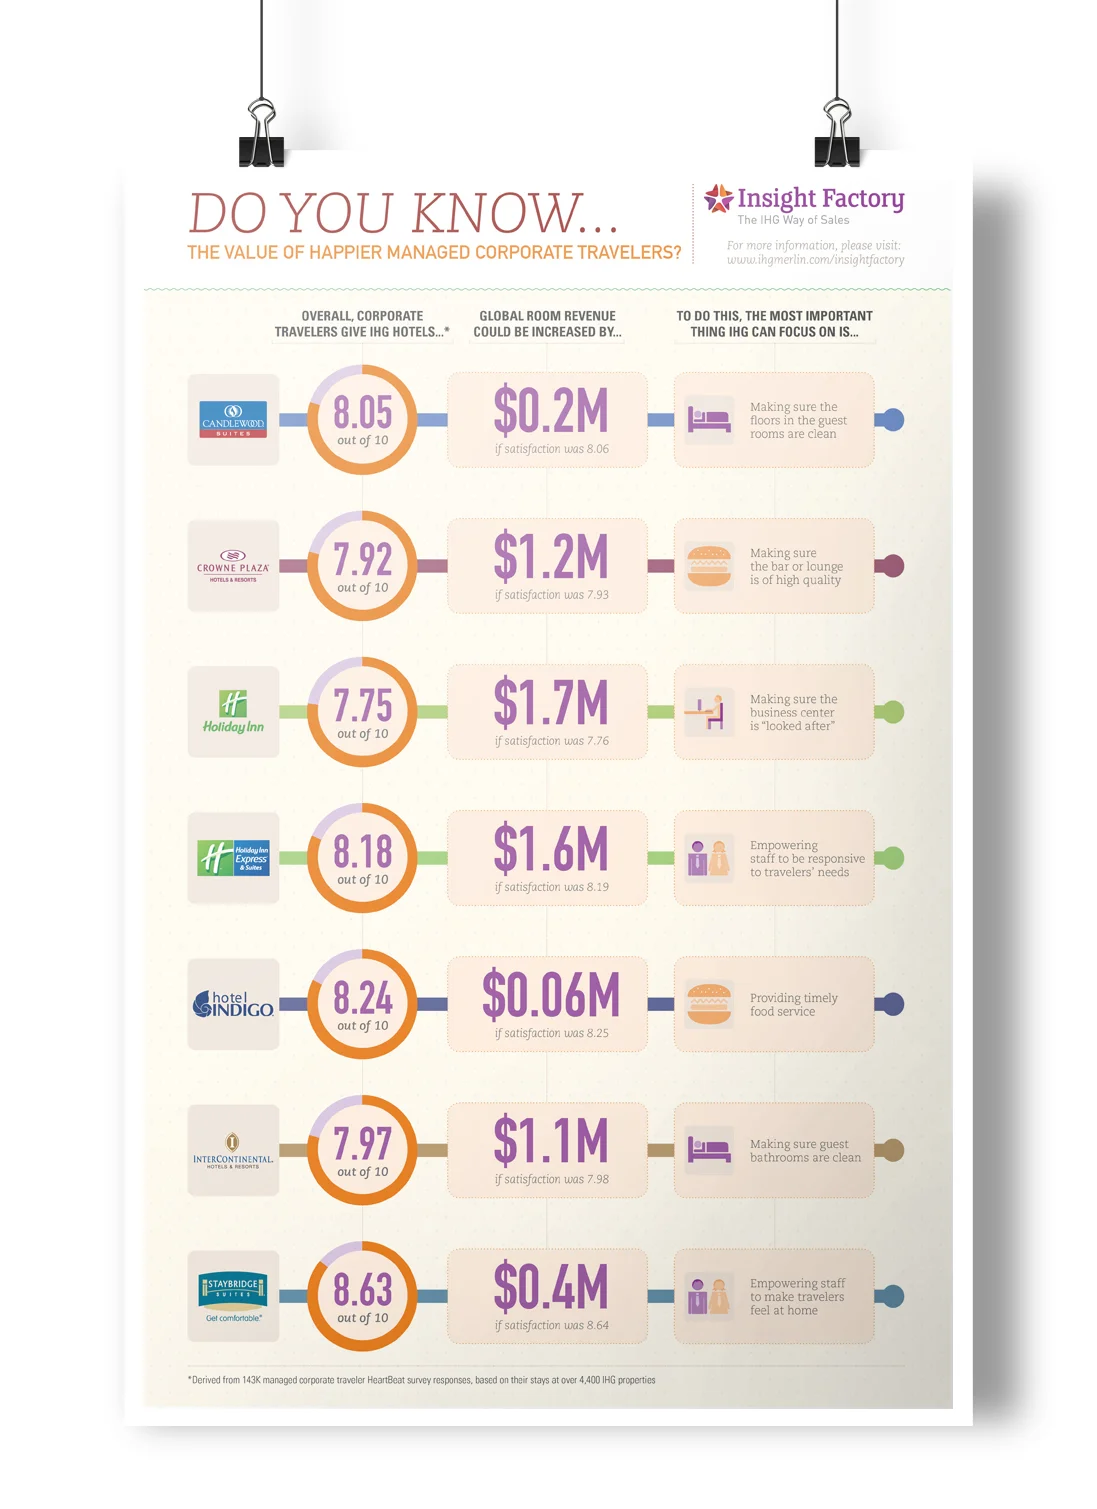
In order to convey large amounts of complex hotel data, I have created a variety of Infographics for IHG. Pictured above is a small
selection of these. Data visualization helps the viewers take in overwhelming amounts of facts and figures in a manageable way.